1、首先,安装并打开Stata软件。
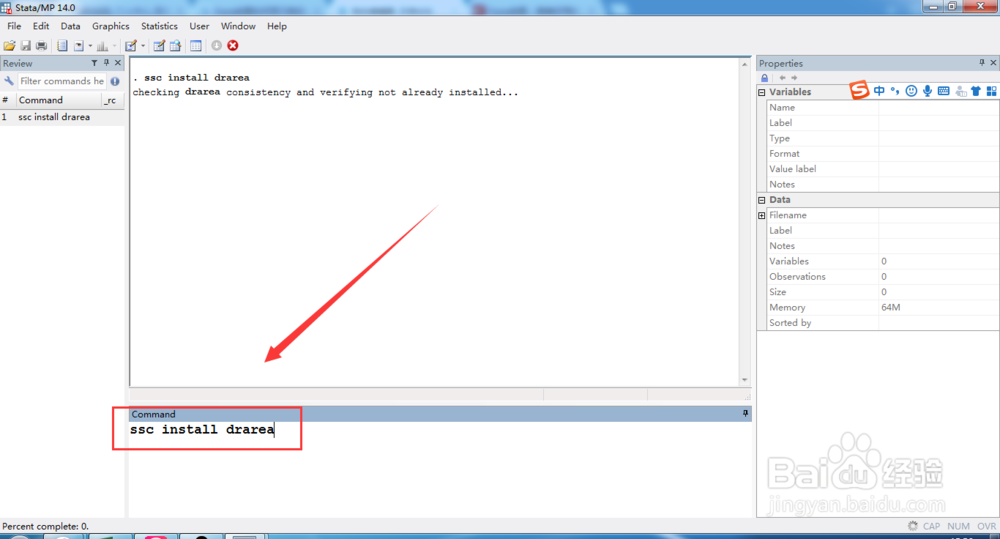
2、输入以下命令:ssc install drarea,安装外部命令drarea。
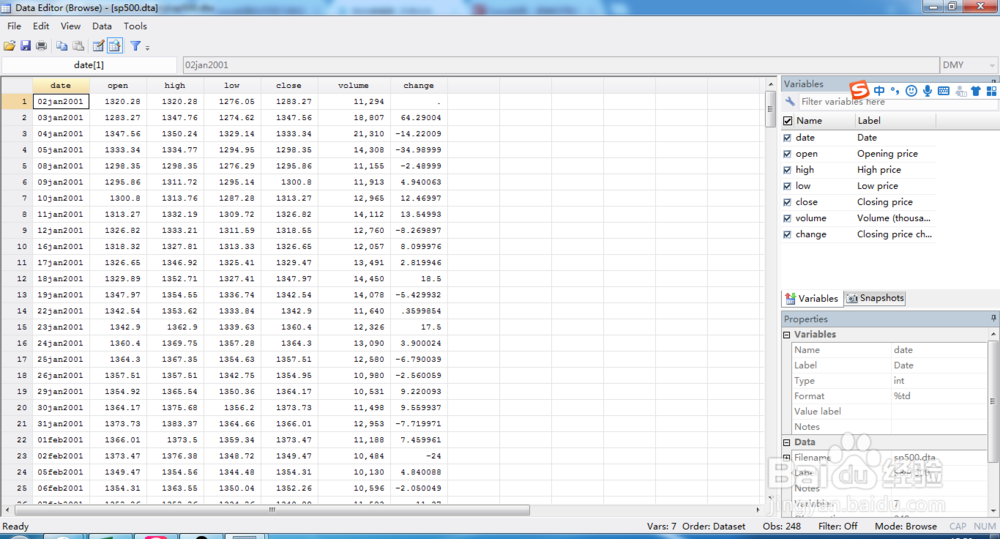
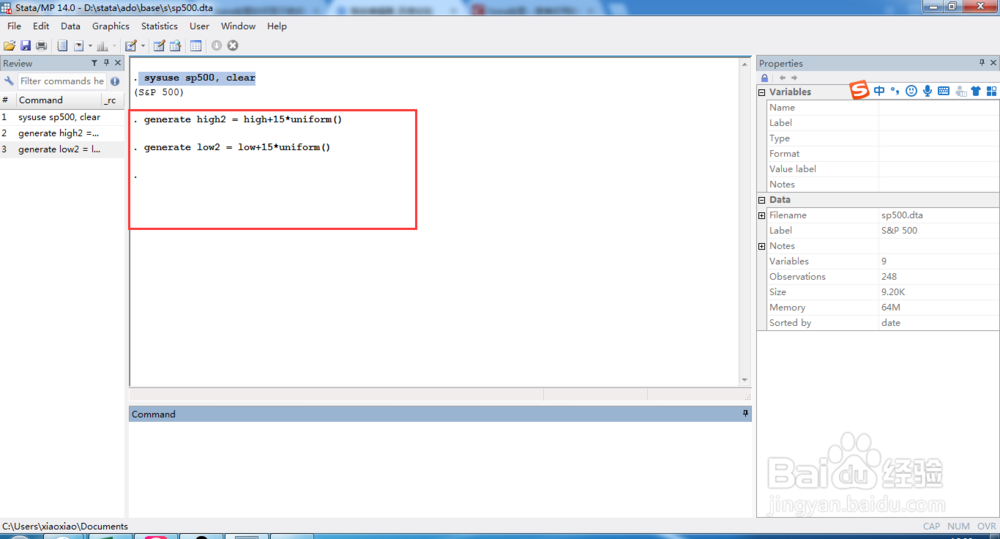
3、导入Stata示例数据标普500指数,命令为:sysuse sp500, clear
4、依次输入下面两个指令,定义两个新的变量,如下图:generate high2 = high+15*uniform() generate low2 = low+15*uniform()
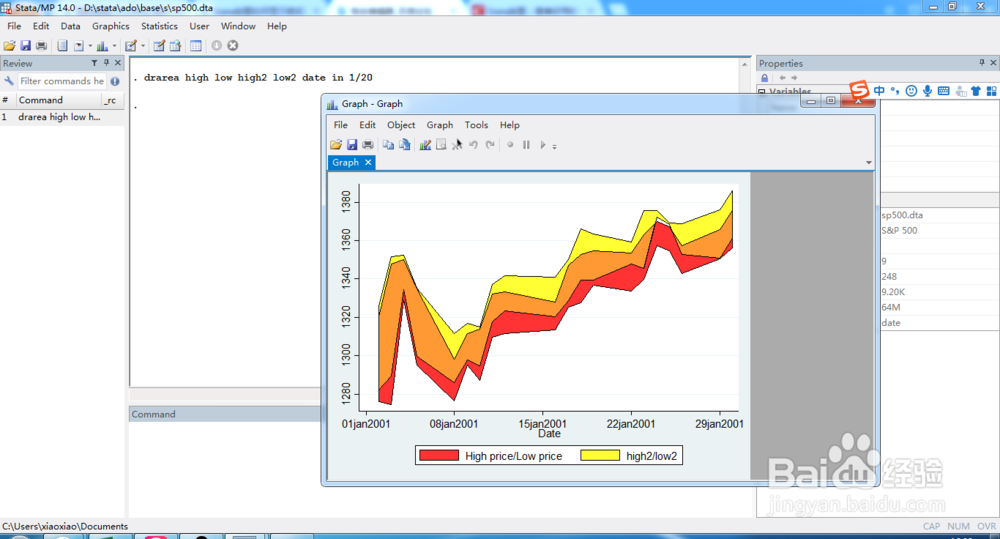
5、最后,分颜色绘图即可。输入命令:drarea high low high2 low2 date in 1/20